Figure viewer#
Shows the simulation result in form of a figure.
Name#
Shows the name of the viewer.
Load case#
Select the load case that should be evaluated.
Evaluation index#
Select the index that should be evaluated.
Number of points#
Define the number of points where the profile deformation should be evaluated.
Figure panel#
The panel can be used to customize the figure.
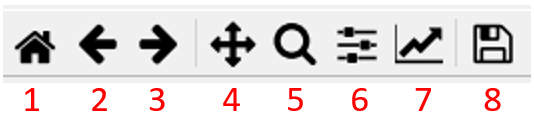
Number |
Function |
|---|---|
1 |
Reset the figure to the default view |
2 |
Undo the configuration step |
3 |
Redo the configuration step |
4 |
Move the region shown in the figure |
5 |
Zoom |
6 |
Define the general layout of the figure |
7 |
Change the style of display of the output data |
8 |
Save the figure |
Figure window#
Shows the selected outputs.
X/Y scale#
Change the scaling of the X and Y axis between linear and logarithmic.
Outputs#
Select the output links that should be displayed.
Configure selected output#
Configure the selected output.
Output type#
Select the type of the output.
Selected entity#
Select the link that should be displayed.
Selected DOF#
Select the degree of freedom that should be displayed.
Scaling#
Scale the outputs.
Label#
Define a specific label to the output.
Line configuration#
Change the color, line style and line width of the line in the figure.
Add output#
Add an output to the result output container.
Export outputs#
Export the outputs to a matlab readable .mat file.
Show in new figure#
Open the figure in a new window.