Static index animator#
Shows and animates the results of the frequnecy response analysis for all given indices. It steps through all indices during animation. This animator is useful for example if the thermo-mechanical deformation resulting from a transient thermal load should be animated.
Figure panel#
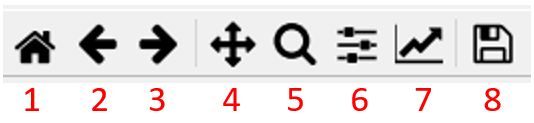
The panel can be used to customize the figure.
Number |
Function |
|---|---|
1 |
Reset the figure to the default view |
2 |
Undo the configuration step |
3 |
Redo the configuration step |
4 |
Move the region shown in the figure |
5 |
Zoom |
6 |
Define the general layout of the figure |
7 |
Change the style of display of the output data |
8 |
Save the figure |
Figure window#
Shows the selected outputs.
Index#
Select the index which should be displayed. The index corresponds to the poses in the tabular static analysis definition.
Show 3D scene#
Open a new window where the deformations are animated.
Start animation#
Start the animation of the selected mode.
Stop animation#
Stop the animation of the selected mode.
Reset view#
Reset the view of the animation figure.
Component visibility#
Select the components that are shown in the animation window.
Format description#
Change the description in the animation figure. The default description is given in the following table. Manual values can also be added.
Variable |
Description |
|---|---|
#simres_name |
Display the name of the simulation result |
#eval_name |
Display the name of the evaluation |
#viewer_name |
Display the name of the viewer |
#index |
Display the number of the index |
#scaling |
Display the scaling |
Outputs#
Select the output links that should be displayed.
Configure selected output#
Configure the selected output.
Output type#
Select the type of the output.
Selected entity#
Select the link that should be displayed.
Selected DOF#
Select the degree of freedom that should be displayed.
Scaling#
Scale the outputs.
Label#
Define a specific label to the output.
Line configuration#
Change the color, line style and line width of the line in the figure.
Add output#
Add an output to the result output container.
Export outputs#
Export the outputs to a matlab readable .mat file.
Export animation#
Export the animation in to a movie.
Start rendering#
Start the rendering of the movie.
End rendering#
End the rendering of the movie.
Filename#
Define the saving location and the filename of the movie.
FPS#
Define the number of frames per second.
Duration#
Define the duration of the movie.
Max/Min val#
Define the start and end time of the simulation.
Start val#
Define the start time of the simulation.
Clip height/width#
Define the size of the movie window.
Export plot animation#
Tick if in the figure should also be exported into an animation, in addition to the animation of the deformation.
Animation delay#
Interval in milliseconds between two frames.
Fileformat#
Define the format of the movie. The possible formats are mp4, avi and gif.
Actual value#
Shows the progress of the movie rendering.
Number of samples#
Define the number of steps between 0 and the amount of poses for the animation.
Animation delay#
Interval in milliseconds between two frames.
Actual value#
Define the progress of the animation with a value between 0 and the number of poses.
Scaling factor#
Scale the deformation of the animation.
Autoscale |
Description |
|---|---|
Step |
Define a value with respect to the current step |
Total |
Define a value with respect to the total maximal deformation |
Manual |
Define a value manually |
Color map#
Change the color map of a thermo-mechanical result.
Max/Min mode |
Description |
|---|---|
Step |
The max and min value are set corresponding to the lowest and highest temperature in the current index |
Total |
The max and min value are set corresponding to the overall lowest and highest temperature |
Manual |
Define the temperature range manually |